If you're like me you want to download all of the Chicago Mayor election results in this April runoff by precinct and you don't want to have to load each ward's page and then copy and paste that into a spreadsheet. Paul Smith was kind enough to share a Python script to download the results but I was unfortunately unable to get his Python script to work so I wrote one in php and got that to work.
Download the 2015 Mayor Runoff by Precinct
Click on the link above to download the April Runoff Election Results by precinct. This will probably take 60 - 120 seconds to run before it lets you save the file. This script will check the CBOE website and then it will write the data to a CSV file that you should be able to download and open in Excel and it will have the Mayor's race election results by precinct. If the CBOE updates their vote totals with either 1) updated precinct totals or 2) updated VBM totals (or both) just click on the link above again and it will pull the latest data.
If something isn't working right let me know. Thanks.
One item really quick, I went to the CBOE website and pulled the registered voter totals from February and the ones they have currently listed for the runoff and put them into the table below, ordered by the largest increase to the smallest.
| Ward | April Registration | Feb Registration | Change |
|---|---|---|---|
| 1 | 29,907 | 29,232 | 675 |
| 46 | 29,349 | 28,676 | 673 |
| 2 | 33,066 | 32,438 | 628 |
| 43 | 30,874 | 30,254 | 620 |
| 32 | 31,084 | 30,469 | 615 |
| 42 | 31,924 | 31,309 | 615 |
| 47 | 33,807 | 33,218 | 589 |
| 44 | 30,377 | 29,803 | 574 |
| 11 | 26,035 | 25,470 | 565 |
| 3 | 32,680 | 32,142 | 538 |
| 25 | 25,731 | 25,194 | 537 |
| 27 | 32,605 | 32,087 | 518 |
| 4 | 31,155 | 30,651 | 504 |
| 48 | 30,279 | 29,787 | 492 |
| 26 | 25,181 | 24,709 | 472 |
| 41 | 34,797 | 34,339 | 458 |
| 45 | 31,649 | 31,191 | 458 |
| 5 | 29,778 | 29,321 | 457 |
| 49 | 25,550 | 25,105 | 445 |
| 40 | 28,228 | 27,800 | 428 |
| 28 | 32,829 | 32,409 | 420 |
| 33 | 23,324 | 22,909 | 415 |
| 35 | 22,243 | 21,846 | 397 |
| 23 | 22,767 | 22,399 | 368 |
| 39 | 29,503 | 29,135 | 368 |
| 13 | 24,298 | 23,932 | 366 |
| 29 | 34,881 | 34,515 | 366 |
| 7 | 32,778 | 32,415 | 363 |
| 31 | 21,792 | 21,429 | 363 |
| 10 | 25,931 | 25,572 | 359 |
| 20 | 26,003 | 25,662 | 341 |
| 6 | 33,994 | 33,658 | 336 |
| 19 | 35,346 | 35,016 | 330 |
| 24 | 27,179 | 26,850 | 329 |
| 38 | 29,900 | 29,593 | 307 |
| 50 | 25,217 | 24,914 | 303 |
| 36 | 21,593 | 21,293 | 300 |
| 16 | 26,365 | 26,071 | 294 |
| 18 | 32,066 | 31,783 | 283 |
| 9 | 36,733 | 36,454 | 279 |
| 37 | 31,608 | 31,338 | 270 |
| 8 | 37,765 | 37,496 | 269 |
| 14 | 18,088 | 17,822 | 266 |
| 30 | 21,605 | 21,339 | 266 |
| 12 | 18,185 | 17,930 | 255 |
| 15 | 18,478 | 18,233 | 245 |
| 34 | 38,714 | 38,472 | 242 |
| 21 | 38,481 | 38,244 | 237 |
| 22 | 19,135 | 18,907 | 228 |
| 17 | 30,780 | 30,599 | 181 |
| Total | 1,441,637 | 1,421,430 | 20,207 |
I had expected to see Hispanic wards with the largest raw increases for two reasons, 1) those wards generally have the lowest raw registration totals so they had the most room to grow and 2) some Hispanic focused polling showed significant enthusiasm about the election.
Instead the wards with the largest raw increase in registration since February tend to be wards that are affluent or white or both. Those are subgroups that tended to favor Emanuel in February. It's impossible to say which candidates these new registrants are most likely to support, you could make a case for either candidate, but looking at these numbers they did not match the numbers I expected to find.
On election night back in February the only vote totals made available by the Chicago Board of Elections were the citywide totals. It wasn't until around 11 or midnight that the ward by ward totals were available. There isn't a whole lot of interesting analysis that can be gleaned from just the aggregate totals so I probably won't be doing much tomorrow night.
My hope is that the major media outlets cover this election night well, I thought they did a good job with the runoff. Keep an eye on the Sun-Times, on election night in February a few of their reporters were discussing ward by ward totals well before the Chicago Board of Elections was making that data publicly available. Also, WBEZ has had a lot of good data work throughout this election.
Here are a few of the questions I think people will want to try to quantify on election night, if possible.
- How many total votes are projected: (total votes counted so far) / (whole number percent precincts reporting / 100)
- What percentage of the uncounted vote does the candidate who is behind need to win in order to move ahead?
- Separate the wards by majority African American, majority Hispanic, majority white and no majority, how did each candidate do? How many total votes in each area? Which areas saw the greatest increase/decrease in support levels and turnout?
You should be able to answer the first two questions even without ward by ward totals. Also, the CBOE should be able to tell you how many vote by mail applications were processed and how many ballots were returned so far. The remainder will be a useful number, if there are 20,000 outstanding VBM ballots and the election night totals are within 20,000 votes you'll want to know that. Any vote by mail ballots have to be postmarked today to be counted but they can be received at any time in the next few weeks.
Unlike November there is no same day registration so the total number of uncounted provisional ballots will not be as significant.
Speaking Engagement
On Thursday afternoon I will be speaking at a lunch panel on the Chicago municipal elections sponsored by the Illinois Campaign for Political Reform. The event is at noon in the French Room of the Union League Club, ticket info is available here.
Post Mortem
I typically do a post-mortem in the day or two after the election to cover all the various insights available from the data. For this election I have agreed to be part of a larger and more comprehensive written report, I will probably even have to double check my spelling and grammar. The report should be available early next week, I'll provide a link when it is available.
The CBOE has updated their election results twice already to include valid late arriving vote by mail votes. They will update on March 10th with final numbers that will include any further late arriving VBM votes and any provisional votes that are deemed valid. There will be some more votes added in before these numbers are finalized and certified but not a huge amount. Here's where the totals stand as of now:
| Emanuel | Garcia | Wilson | Fioretti | Walls | Total |
|---|---|---|---|---|---|
| 217,118 | 159,600 | 50,604 | 35,241 | 13,190 | 475,753 |
| 45.64% | 33.55% | 10.64% | 7.41% | 2.77% |
Using round numbers there were about 475K total votes in this race and just shy of 100,000 people (99,035) voted for one of the candidates that did not qualify for the runoff. Those votes are in play and we discussed them in detail the other day.
Let's assume for a second that everyone who voted for each of Emanuel and Garcia last month votes again in April and for the same candidate. With that assumption Emanuel starts with a lead of almost 58K votes (57,518) that Garcia needs to make up, and obviously the most fertile ground to find those votes is among the people who voted for either Wilson/Fioretti/Walls because they've already turned out for an election once this year. Now let's also assume that of the voters who voted for either Wilson, Fioretti or Walls back in February at least some of them decide to stay home in April because they just don't favor either candidate in the runoff. There comes a point where if that number gets sufficiently large then Emanuel doesn't have to win over any new voters to win the runoff, he could theoretically win the runoff by holding his existing coalition among an April electorate that has shrunk from the February electorate.
Garcia has to keep these Wilson/Fioretti/Walls voters in the April electorate and voting. If 42% of them don't turn out in April then Garcia can't win without expanding the electorate in other places. Even if the Wilson/Fioretti/Walls voters lean moderately to heavily anti-incumbent he has to win them over and turn them out, of those roughly 100K votes he has to get the first 58K and then do no worse than split the rest.
Other Options - Expand the Electorate
The next and possibly more difficult option is to try to expand the electorate. As we saw last week, historically runoff elections in Chicago have lower turnout than the February election. This is our first runoff election for Mayor in the modern era so perhaps this runoff will behave differently. If Garcia is going to be able to expand the electorate in his favor these are his most likely avenues:
- Natural Growth - there is a plausible theory that now that the Mayor's aura of invincibility has been pierced voters who are displeased with his first administration but did not think their vote would matter will turn out this time around. There will also likely be a subset of voters who favor the Mayor who have the same rationale, however given the anti-incumbent mood displayed by the voters in February overall this likely favors Garcia. It's impossible to know how large this natural growth could be and it will mostly be organic and not necessarily as a result of any particular GOTV effort by the campaigns.
- Hispanic Voters - Garcia's strongest subset in February was with Hispanic voters so his best chance to expand the electorate in his favor for April is in this subgroup. Garcia faces two difficult challenges here: 1) Hispanics are generally registered at lower rates than other subgroups and turnout can often be mixed at best. Of the 10 wards with the fewest ballots cast in February 9 were majority Hispanic population wards. Of the 12 wards with the poorest turnout percentage in February 6 were majority Hispanic population wards, 5 were majority AA wards and the remaining one had no majority. 2) While Garcia won a majority of Hispanic voters in February Emanuel held his own (56-34). Even if Garcia wins the support of all of the Hispanics who voted for Wilson/Fioretti/Walls in February he's still only netting 32 votes for every 100 new people he turns out. If he was going to try to make up his entire 58K deficit here he'd have to turn out 181K new Hispanic voters, only 73K people living in majority Hispanic census tracts turned out in February. The math here isn't easy.
- Disaffected Liberals - According to Politico "Democracy for America and MoveOn.org, are partnering on field efforts, and the Progressive Change Campaign Committee, is raising money for the cash-starved Garcia". Looking at the breakdown of February's results by demographic data if large numbers of disaffected liberals exist it's not easy to identify them based on demographic profiles. Emanuel won majority white census tracts outright and the higher an area's income and/or the higher the percentage of college graduates the more likely that area was to support Emanuel. Perhaps these experienced groups have found the formula for identifying and motivating like minded individuals. More likely Garcia's best hope for finding and turning out disaffected liberals is that DFA and MoveOn have lengthy member lists in the area and they can put an effective member to member contact program together.
- Organized Labor - it's clear that the Chicago Teacher's Union will go all out for Garcia, CTU appears to have taken a big step forward this cycle, and CPS is on Spring Break the week of the April election so they'll have a tremendous opportunity to activate their members on election day. After that though, it gets a bit murky. The politically experienced Service Employees International Union was neutral in the primary and while they've publicly said they would reevaluate getting involved in the runoff they also seem to be going through some internal division within the union and it's hard to predict what they will do. Then you get to the building trades and while the conventional wisdom is that the unions are generally united in opposing Emanuel many people forget that many of the building trades actually endorsed Emanuel. In February Emanuel did poorest with the less affluent voters and the unions are historically the best at member to member communications so the opportunity for Garcia here is real, it's just not clear that organized labor is as united in opposing Emanuel as people seem to think they are.
- Others - Wilson did best with AA voters, almost 80% of his votes came from areas with AA majority population, so an endorsement from him could be a boost but somehow his endorsement has taken on a life of its own and become a bit of a side show. Fioretti appeared to do best with blue collar white voters, among voters living in majority white precincts with a median household income between $60,000 - $100,000 Fioretti's support was twice as strong where less than 40% of the population had a bachelor's degree than the areas where more than 40% had a bachelor's degree. If Fioretti can be of any help to Garcia it's likely among this group.
Garcia has momentum on his side and a mathematically plausible path to victory, but the math for him isn't easy. Looking at his February numbers there is no one subgroup where he had sufficient support to have a clear focus, if he is going to emerge victorious it seems like it will require a multifaceted approach. If the size of the runoff electorate in April shrinks as has historically been the case then Emanuel moves closer to victory simply by holding his current coalition together. Garcia has to find the raw votes to make up that difference, either by winning over the supporters of other candidates or turning out new voters. Early voting starts two weeks from Monday, the clock is ticking.
Because we have shapefiles (GIS data files) of the Chicago precinct boundaries from Tuesday's 2015 Mayoral election we can use software to match them up against any other data set where we have shapefiles, including 2010 US census data. I ran an intersect on the precinct boundary shapefiles against the 2010 census data by census tract (and then prorated the vote totals based on the percentage of land area overlap) so that I could merge data on median household income, education as measured by the percentage of people in a census tract that had a bachelor's degree or higher and also a much more granular estimation of race than the tracker from the other night. It yielded some interesting results.
Download the Results (Spreadsheet)
Analysis:
Early voting starts in a little over three weeks (March 23rd) so these two candidates have very little time to persuade voters. It will be interesting to see which of these two campaigns tries to win over new voters vs. which ones just focus in increasing turnout among the subsets of voters where they have the most support.
It probably won't come as a surprise for you to learn that the Mayor did better with affluent voters than the less affluent voters but it did surprise me to learn that a small majority (50.3%) of voters on Tuesday live in census tracts where the median household income is less than $60,000. The Mayor only won that group 41-34 as opposed to the people who live in census tracts with median household income above $60,000 where the Mayor's margin was greater at 50-33. There is a pretty clear financial divide for these two candidates that may prove beneficial for GOTV strategies.
In census tracts with a majority Hispanic population Garcia won an outright victory 56-34, however only 15% of Tuesdays voters live in those areas. On the other hand Emanuel won a clear victory in census tracts with a majority white population 53-32 and 37% of Tuesday's voters live in those areas. Even though Garcia has a natural base with Hispanic voters that base is smaller than the voting population of other ethnic groups.
34% of the voters who live in majority African American census tracts voted for one of the candidates that didn't qualify for the runoff, these voters are now coveted by both candidates. Among the voters who live in majority African American census tracts Emanuel's support is roughly the same regardless of household income. For example the AA voters who live in census tracts with a median HH income between $0 - $20,000 supported him at 42.5% while the AA voters with median HH income between $80,000 - $100,000 supported him at 41.5%. On Tuesday Emanuel won the support of more AA voters than any other candidate and whatever message it was that won him that support seemed to work the same regardless of the voter's income.
On the other hand, Garcia's support among the voters who live in majority AA census tracts did vary by income and he had greater support among the more affluent African American voters than the less affluent. For example the AA voters who live in census tracts with a median HH income between $20,000 - $40,000 supported him at 21% while the AA voters with median HH income between $100,000 - $120,000 supported him at 36%. Garcia has two challenges here 1) he earned a greater rate of support among affluent AA voters on Tuesday but the vast majority of the AA voters on Tuesday came from the less affluent census tracts (1/3 of the AA voters came from tracts with median HH income less than $40,000 and 82% less than $60,000) so he'll have to tailor his persuasive message toward the less affluent if he wants to improve his support rate, and 2) he has a difficult needle to thread in that his best GOTV strategy for the city overall is to focus on voters in < $60,000 census tracts while his best performing AA subsets are the more affluent ones.
Voters in majority white census tracts tended to be somewhat more affluent than their counterparts in majority AA or majority Hispanic census tracts. For example only 7% of voters who live in majority white census tracts had a median HH income under $60,000 whereas 82% of voters who lived in either of AA or Hispanic majority census tracts had a median HH income under $60,000. So voters in majority white census tracts tend towards the higher income brackets compared to their counterparts in AA or Hispanic majority tracts and there is a clear correlation between an increase in income bracket and an increase in support for the Mayor but there is still a ray of hope for Garcia among middle class white voters. A good majority of white voters (59%) live in census tracts with a median HH income between $60,000 - $100,000 and of all of the subsets of white voters this is where Emanuel did the worst, falling just below 50%. Also, even though Fioretti didn't win much support anywhere this was the subset of voters where he was the strongest. Garcia has the opportunity to make some inroads with middle class white voters.
When I ran the numbers I included data about education as measured by the percentage of people in each census tract that had a bachelor's degree or higher but I haven't included this data in this analysis mostly because those numbers track pretty closely to the income bracket numbers. Higher income areas tend to have a higher percentage of college educated people so the conclusions tend to mirror one another.
Election day is a little more than 5 weeks away and in a little more than 3 weeks early voters can start casting ballots again so there isn't much time to turn out voters and there is even less time to win over new ones. For either campaign to emerge successful they're going to have to study these data subsets and find their winning formula.
Total Votes - Participation Rate:
There has been a lot of attention given to the fact that turnout last night was significantly lower than four years ago, which is true, however that year was a bit of an outlier and this year's numbers track pretty closely to the 2007 and 2003 Chicago Municipal elections:
| Reg Voters | Tot Mayor Voters | Participation Rate | |
|---|---|---|---|
| Feb 2003 | 1,436,286 | 463,145 | 32.25% |
| Feb 2007 | 1,407,979 | 456,765 | 32.44% |
| Feb 2011 | 1,406,037 | 590,357 | 41.99% |
| Feb 2015 | 1,421,430 | 466,177 | 32.80% |
With some valid late arriving vote by mail ballots left to be counted the total votes in the Mayor's race last night currently stands at about 466K (very close to my projection last night) and a participation rate of a little under 33% on about 1.4 million registered voters. You can see that over the last four cycles the number of citywide registered voters has stayed within a band of 30,000 so it's held pretty flat. The total vote last night held remarkably similar to 2003 and 2007. In other words last night's election was nothing special, wasn't a big turnout like 2011 and wasn't a horrible one either, it just tracked well with other recent elections with an incumbent Mayor.
Projecting April's Turnout:
Today I saw two schools of thought on the likely turnout for the April runoff: 1) the number of total voters in the Mayor's race in the April runoff will be lower because a) there aren't competitive aldermanic elections in every ward, b) some supporters of the candidates that did not qualify for the runoff will not vote and c) election fatigue. The other school of thought is 2) the number of total voters in the Mayor's race in the April runoff will actually be higher than February because a) with a slimmed down field the campaign coverage will be more focused and more voters will be paying attention, b) the Mayor's veil of invincibility has been pierced leading some disaffected voters to participate, c) the weather will be better and d) with fewer other races to distract the campaigns or dilute the campaign staffs more people will be working to drive up turnout.
I still tend to believe that the overall number of voters in the Mayor's race in April will be lower than the total from February but I find the conversation interesting. We don't have much historical data to work with, there hasn't been a runoff in the Mayor's race since the current format was put in place in 1999. However we can look at all of the aldermanic elections that went to runoff in the last three cycles and see how regularly the April runoffs featured more total voters than the February elections:
| Year | Ward | Feb Total | Apr Total | Diff | Diff % |
|---|---|---|---|---|---|
| 2011 | 6 | 15,045 | 10,114 | (4,931) | -32.8% |
| 2011 | 15 | 7,059 | 3,550 | (3,509) | -49.7% |
| 2011 | 16 | 6,116 | 3,654 | (2,462) | -40.3% |
| 2011 | 17 | 9,900 | 6,063 | (3,837) | -38.8% |
| 2011 | 20 | 7,467 | 4,518 | (2,949) | -39.5% |
| 2011 | 24 | 9,255 | 5,490 | (3,765) | -40.7% |
| 2011 | 25 | 8,823 | 7,291 | (1,532) | -17.4% |
| 2011 | 36 | 14,052 | 10,074 | (3,978) | -28.3% |
| 2011 | 38 | 12,256 | 7,880 | (4,376) | -35.7% |
| 2011 | 41 | 20,109 | 14,458 | (5,651) | -28.1% |
| 2011 | 43 | 14,267 | 9,644 | (4,623) | -32.4% |
| 2011 | 45 | 15,879 | 12,136 | (3,743) | -23.6% |
| 2011 | 46 | 13,906 | 9,967 | (3,939) | -28.3% |
| 2011 | 50 | 11,487 | 9,698 | (1,789) | -15.6% |
| 2011 | Combined | 165,621 | 114,537 | (51,084) | -30.8% |
| 2007 | 2 | 11,103 | 9,399 | (1,704) | -15.3% |
| 2007 | 3 | 8,087 | 8,369 | 282 | 3.5% |
| 2007 | 15 | 6,046 | 4,641 | (1,405) | -23.2% |
| 2007 | 16 | 6,104 | 5,278 | (826) | -13.5% |
| 2007 | 18 | 13,228 | 8,970 | (4,258) | -32.2% |
| 2007 | 21 | 14,096 | 10,563 | (3,533) | -25.1% |
| 2007 | 24 | 8,421 | 6,416 | (2,005) | -23.8% |
| 2007 | 32 | 8,107 | 8,237 | 130 | 1.6% |
| 2007 | 35 | 6,561 | 6,543 | (18) | -0.3% |
| 2007 | 43 | 9,307 | 8,321 | (986) | -10.6% |
| 2007 | 49 | 7,441 | 7,803 | 362 | 4.9% |
| 2007 | 50 | 10,489 | 11,325 | 836 | 8.0% |
| 2007 | Combined | 108,990 | 95,865 | (13,125) | -12.0% |
| 2003 | 1 | 6,930 | 9,007 | 2,077 | 30.0% |
| 2003 | 6 | 12,686 | 9,354 | (3,332) | -26.3% |
| 2003 | 15 | 6,048 | 4,450 | (1,598) | -26.4% |
| 2003 | 21 | 13,451 | 11,902 | (1,549) | -11.5% |
| 2003 | Combined | 39,115 | 34,713 | (4,402) | -11.3% |
Looking at the table above the general expectation for an aldermanic runoff is the April election will have fewer total votes than the February election, in fact the average for the 14 aldermanic runoffs of 2011 was about 31% lower (12% lower on average in 2007 and 11% lower on average in 2003). There are a few exceptions of course but it's clear that April just has a lower participation rate.
However I would caution these totals are just for downballot aldermanic races. A runoff in a Mayor's race is likely to lead most newscasts over the next 6 weeks. You'll also see plenty of broadcast TV ads and heavy mail and likely phone calls or door knocks. The level of attention given to this runoff will be very different from these past aldermanic runoffs. No matter what your preferred theory is for turnout in April I don't think the data rules out any possibility.
Late last night the Chicago Board of Elections made their ward by ward (and precinct by precinct) numbers available and I was able to plug those numbers into the tracker I would have used had those numbers been available earlier in the night. Most of these insights are derived from a quick glance at the tracker.
2015 Chicago's Mayor's Race Election Night Tracker
A few thoughts:
- In majority AA wards (by census) Emanuel (42%), Garcia (26%), Wilson (22%), Walls (6%), Fioretti (5%). In wards with an AA majority 32% of the vote went to candidates that will not be in the runoff so it will be interesting to see where these voters fall.
- In majority Hispanic wards (by census) Garcia (52%), Emanuel (37%), Fioretti (7%), Wilson (3%), Walls (1%). Only 11% of this vote went to candidates not in the runoff.
- In wards with a white majority (by census) Emanuel (52%), Garcia (34%), Fioretti (10%), Wilson (4%), Walls (1%). 15% of this vote went to candidates not in the runoff.
- In wards with no majority (by census) Emanuel (49%), Garcia (35%), Fioretti (9%), Wilson (5%), Walls (1%). 15% of this vote went to candidates not in the runoff.
- Reminder, the "2011" numbers in my tracker were reconfigured to match the current ward maps. In the majority AA wards the 2015 numbers for Emanuel were about 12-20 points lower than 2011.
- It was harder to draw conclusions about the Hispanic majority wards, some showed Emanuel improvement (10/13/14/31), others big drop (22/25/33/35).
- In only a very few wards did Emanuel improve over his 2011 numbers but somehow in the 13th ward he did almost 15 points better. Interesting.
- It appears that 19 aldermanic races are headed to an April runoff (2, 7, 10, 11, 15, 16, 18, 20, 21, 24, 29, 31, 33, 36, 37, 41, 43, 45, 46). So while the overall numbers were Emanuel (45%), Garcia (34%), Wilson (11%), Fioretti (7%), Walls (3%), if my math is correct in just the 19 wards that are headed to aldermanic runoff the numbers were Emanuel (46%), Garcia (31%), Wilson (12%), Fioretti (8%), Walls (3%). The Mayor did slightly better than average in these 19 wards but there is also 23% of the vote in these 19 wards that went to candidates that won't be in the runoff so it will be interesting to see where those voters fall. Obviously these 19 wards are likely to have higher turnout in April than the wards without Aldermanic elections.
Here are some of the big questions going into April:
- Of the 21% of voters who voted for one of the candidates who didn't qualify for the runoff, where does their support go? These voters are largest among wards that have an AA majority by census so you'll likely see a significant focus of the campaign in those communities between now and April.
- Can Garcia expand on his 52% of the vote in Hispanic majority wards and can the Mayor continue to make inroads among Hispanic voters despite having a Hispanic candidate in the race?
- What happens in the 19 wards with Aldermanic runoffs and how does that affect the Mayor's race?
Now we have a six week sprint until April.
UPDATE: our election night tracker for the Chicago's Mayor's race is now live:
2015 Chicago's Mayor's Race Election Night Tracker
End of update.
The Chicago municipal elections are on Tuesday for all 50 aldermen/women, the Mayor, the City Clerk and the City Treasurer.
Since the last Chicago municipal election in 2011 the City of Chicago has redrawn their ward boundaries. The Mayor's race is not expected to be close on Tuesday but it is expected that Mayor Emanuel will come very close to reaching or exceeding the 50% + 1 threshold needed to avoid a runoff. I thought it would make sense to take the precinct level data from the 2011 Mayoral election and reconfigure those vote totals based on the new ward map. Some of the wards are similar to the 2011 map but some, such as the 2nd ward, are very different. I think it will be interesting to see how the Mayor's 2015 numbers compare to his 2011 numbers and this will give a better apples to apples comparison.
Download 2011 Chicago Mayor by 2015 Ward Boundaries
I took the shapefiles for the 2011 citywide precincts and dumped that into some GIS software and ran an "Intersect" against the shapefiles for the current ward boundaries. I then used the percent of land area to assign a percentage to precincts that covered multiple wards. This is not exact for reasons I won't bore you with but it's pretty close. If you download the link above you'll see a summary sheet with the data I just described as well as a worksheet that shows the precinct by precinct analysis and also there's a sheet that shows the percentage of voters by race in each ward from census data. You may find any or all of that useful.
State of the Mayor's Race
Both the City Clerk's race and the City Treasurer's race feature unopposed incumbents so the only actual citywide race is the Mayor's race.
Thanks to the team at Aldertrack, this cycle's indispensable daily must-read for all Chicago related election news, who teamed up with pollster Ogden & Fry for a regular tracking poll we have this graphic below showing how little traction the challengers have made.
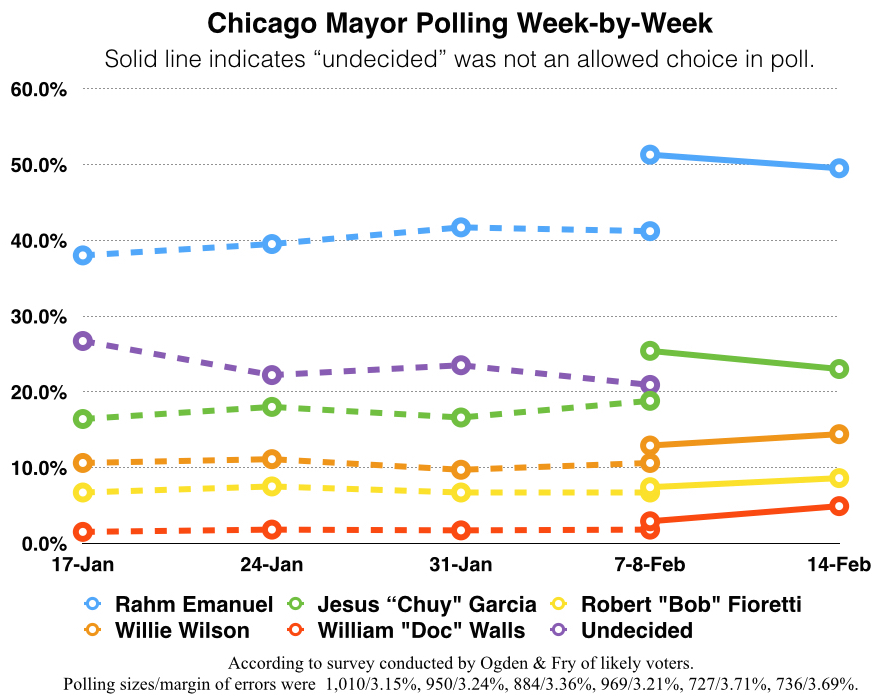
Prior to the start of early voting the Mayor was polling in the low 40's, undecided was in 2nd place in the low 20's and the challengers were either in the teens or single digits. Since the first week of February when early voting started they have stopped offering undecided as an option and the Mayor is hovering right around 50% with his challengers well behind. Unless something really unexpected happens Emanuel will finish first on Tuesday and the main point of interest will be to see if he can beat the 50% + 1 threshold needed to avoid a runoff. (Emanuel avoided a runoff in 2011 with 55.28% of the vote)
I am going to spend some time over the weekend looking at building a dashboard for the Mayor's race. If I can make it work the way I hope I may turn it on for election night on Tuesday. I'm mainly interested in seeing in real time how the Mayor is doing against his runoff threshold and how each ward compares to his 2011 numbers. If I can build a straightforward easy to read dashboard that auto-updates every 2 minutes or so I'll make it live and distribute the link. Keep an eye on the Illinois Election Data Twitter account @ILElectionData and I'll try to let you know by Monday if I think I can do something for Tuesday night. (Why is there always a Hawks game on election night?)
Chicago Board of Elections Website
The Chicago Board of Elections already has live links to their 2015 Municipal election results in their Election Results section. If you go to their website then click on Election Results you'll see that in the dropdown below you can select "2015 Municipal General - 2/24/15" as one of the options. From there you can select whatever race you want. None of the race pages have numbers yet, obviously, but it's nice that the links are live and available so that you know where you can find the results when they're available.
A note about Aldertrack: this group of political hobbyists have spent the last few months amassing a wealth of political information and making it widely available for little or no cost. You can buy their data-rich Racing Form for $10 (it's actually currently free until election day but if you find it useful you should give them some money). Also you can sign up to receive a free daily email that includes original reporting, polling, reports from the field and a news roundup for all the Chicago races. I highly recommend.
At at time when news organizations are downsizing both Aldertrack and the also terrific Illinois Observer have been very welcome additions to the Illinois political news scene. I am not affiliated with either organization.
Today outgoing Governor Pat Quinn signed two election bills into law, 1) HB4576, which passed both chambers during a special session on Thursday, that will allow for a special election for certain constitutional offices under certain circumstances and will result in a special election in 2016 for Comptroller to fill the remaining term of the late Judy Baar Topinka, and 2) SB172 the omnibus elections bill that was passed during veto session which has received the most attention for making same day registration permanent but also makes changes to vote by mail, early voting, college campus voting, vote counting procedures and election administrative changes.
For anyone who followed the lengthy vote counting process in the very close 2014 State Treasurer's race SB172 includes some changes that will make more vote counting information available for any similar situations in the future. Here is a rundown for both bills.
HB4576
This bill is pretty straightforward, this about covers it:
Provides that if there are more than 28 months remaining in the term of office for Secretary of State, State Comptroller, Treasurer or Attorney General, the appointed office holder shall serve until the next general election, at which time the office shall be filled by special election for the remainder of the term. Provides for nominations for special elections to fill the unexpired term of a vacant office. Effective immediately.
SB172
Voter Registration
- Same Day Registration (Grace Period Registration): extends grace period registration up to and including election day. Election authorities in counties with a population of greater than 100,000 or election authorities that have electronic poll books must offer in-precinct same day registration. Election authorities in counties with a population less than 100,000 that do not have electronic poll books may opt out of in-precinct same day registration but they must offer same day registration at their main office and must include a location in any municipality where 20% or more of the county's residents reside.
- ERIC Registration: beginning in 2016 requires participation in the Electronic Registration Information Center (ERIC) system.
- National Change of Address check: requires the SBE to perform a check of the Postal Service's National Change of Address database to find voters who have moved. Voters who have changed their address will be automatically re-registered at their new address after being given an opportunity to opt out
- State Websites: requires all executive department websites to link to the statewide online voter registration.
- Phone App: requires the SBE to develop a phone app for voter registration.
- Government Offices: requires that when a person is interacting with a state agency online or at their government office they can easily register to vote or update their registration.
Voting
- Provisional Voting: a voter attempting same day registration on election day that does not have the necessary documentation may still vote provisionally. That voter will then have 7 days to submit the proper documentation to their election authority.
- Early Voting: early voting now runs up to and including the day before election day. During the final week of early voting the locations must be open until 7pm on weekdays. Saturdays are 9am - noon and Sundays are 10am - 4pm. Permanent sites must offer grace period registration. Each election authority must provide the SBE a list of early voting locations and hours, the SBE will make this info available on their website.
- Vote By Mail: ballots must now be postmarked no later than election day (it used to be the day before), ballots can be delivered by any carrier, ballots may be returned in person to the election authority by any authorized person (previously only family members) and election authorities must print the amount of postage required on the return envelope.
- Campus Voting: early voting and grace period registration must be available in the student union Wed - Fri from 10am to 5pm before a general primary or general election but not during a consolidated election.
Vote Counting
- Ballot Processing: election authorities may process ballots up to 15 days prior to election day but they may not count/tabulate the ballots until after the polls close.
- Uncounted Ballot Disclosure: after election day each election authority must report to the SBE the number of uncounted ballots and the SBE must make this info available on their website.
- Announcements: election authorities must provide at least 24 hours advance notice the date, time and location where they will analyze, cast or count any centrally located ballots and they must send email notification to anyone requesting notification.
- Wrong Precinct: codifies current SBE rules regarding counting ballots cast in the wrong precinct.
Election Administration
- Eliminates "Absentee Voting": removes any references to "absentee voting" which is now obsolete and has been replaced by early voting and vote by mail.
- Polling Places: requires election authorities to disclose polling places that designate their entire property as campaign free.
- Petitions: clarifies the SBE's jurisdiction over petitions for the General Assembly when the districts are not entirely within Cook County, sets the signature requirements for Chicago aldermen (473 signatures) and eliminates the requirement that statewide advisory referendum petitions must be segregated by election jurisdiction.
- Election Judges: in Cook County the township and ward committeemen now have final approval of partisan election judges (used to be the county chairman).
- "I Voted" Stickers: if an election authority distributes "I Voted" stickers must make them available to all voters.
- Pollwatchers: cleaned up language on pollwatchers watching the casting of vote by mail ballots in a precinct on election day.
As I mentioned before starting with the 2014 General Election the Illinois State Board of Elections has made precinct-level vote totals available for all races. The State Board offers flat files in csv format for each of the state's election authorities. I have assembled that data, formatted it and created some interesting tools.
First, to find this new data click on "ANALYSIS" and then "Precinct Level Election Results". Here is a rundown of what is available:
- Download Raw/Formatted Data - Click here to download 1) all of the raw data aggregated from the State Board of Elections (flat file); 2) a statewide csv file of all races formatted for use (flat file); and 3) a sample Microsoft Access database that uses the full statewide formatted file plus has some query examples that demonstrate how the data can be used.
- View Race by Precinct - Click here to select a race and view the election results by precinct. Every race except for the statwides can be viewed by precinct, the statewide races are too large to load on the screen. Instead there is an option to download each of the statwide races that can be opened in any spreadsheet program.
- View Race by County - Click here to select a race and view the election results by county. This code aggregates the precinct-level database into county by county results. If you are concerned that there is an error in the precinct-level database file you can use this tool to view the county by county totals and compare them to the certified election results and check for discrepancies.
- View Statewide Race by Districts (Simple Method) - Click here to select a statewide race and view the election results by districts (congressional, state senate or state rep). This process uses the simple method, which has to do with instances where more than one district are represented in a precinct. Using the simple method the entire precinct data is used for any precinct that is in part or in whole in each district. More complicated methods may be available in the future.
Also if you want to see Statewide Race by Districts in table format we have that too:
- View Statewide Race by Congressional Districts (Table View)
- View Statewide Race by State Senate Districts (Table View)
- View Statewide Race by State Rep Districts (Table View)
The statewide file is large, it's about 1.8 million records so some pages may take a few seconds to load. Also, when looking at statewide races by district (congressional, state senate, state rep) currently the only method available is the Simple Method which includes any precinct that is in whole or in part in the district. I hope to be able to add a more complex apportionment method where precincts that include more than one district have those votes apportioned to one district or another. For reasons I won't get into you can't guarantee that one method is more accurate than the other but the apportionment method is generally favored. If you'd like to develop your own methodology for evaluating the data I have made the raw and formatted data available for easy download so you can use it as you wish. In the meantime I wanted to publish what I had here so I could move on to finishing up the maps and then get the 2014 monthly campaign budgets done later this month.
Feel free to contact me with any questions at Scott.Kennedy (at) illinoiselectiondata.com or on Twitter at @ILElectionData.
Enjoy.