Here's a handy guide to the various Illinois congressional remap proposals released so far. For any proposal that included a GIS version of their map (Google Maps, KML, shapefile) I calculated the historical vote totals from 2016, 2018 and 2020 using the precinct total shapefiles from the Harvard dataset. Not all proposals included that kind of map so I wasn't able to perform that calculation for all.
Proposals submitted to the Illinois General Assembly portal can be found here.
Data for the current map (2011 - 2021) can be found here.
| Proposal | Demographics | Map | Vote Totals |
|---|---|---|---|
| ILGA Map Proposal | View | View | View |
| ILGA Map Proposal 2 | View | View | View |
| ILGA Map Proposal 3 | View | View | View |
| ILGA Map Proposal 4 (PASSED BY BOTH CHAMBERS) | View | View | View |
| Zach Koutsky Proposal | View | View | View |
| Zach Koutsky Proposal 2 | View | View | View |
| Bev D Proposal | View | View | View |
| PJ James Proposal | View | View | View |
| Frank Calabrese Proposal | View | Included | N/A |
| Andrew Ellison Proposal | View | Included | N/A |
| Issac Leal Proposal | View | Included | N/A |
| Trevor Anderson Proposal 1 | N/A | View | N/A |
| Trevor Anderson Proposal 2 | N/A | View | N/A |
| Trevor Anderson Proposal 3 | N/A | View | N/A |
Here are the precinct-level shapefiles from the Harvard dataset.
| File | Source |
|---|---|
| 2020 Election Results by Precinct | Source |
| 2018 Election Results by Precinct | Source |
| 2016 Election Results by Precinct | Source |
Here are the Statewide election results for the 2016, 2018 and 2020 general elections by State House and Senate districts for the new maps:
House: https://illinoiselectiondata.com/analysis/precinct/statewidebystaterep.php
Senate: https://illinoiselectiondata.com/analysis/precinct/statewidebystatesen.php
Note: the General Assembly has amended the 2021-2030 map, this data has been updated to reflect the amended map passed on 09/01/21 by the ILGA.
To navigate to these datasets without direct links you can go: Home --> Analysis (top nav) --> Precinct Level Election Results --> View Statewide Race by Districts (Table View)
To get these totals I took the shapefiles of the new maps and intersected them with the shapefiles of the results of the 2016, 2018 and 2020 elections. For precincts that are now in more than one district I prorated the vote totals by the land area of the intersection, so if 40% of the land area of Precinct A was in District 1 then 40% of the vote totals of that precinct were assigned to District 1.
Data Sources:
| File | Source |
|---|---|
| New Map - Illinois State Senate | Source |
| New Map - Illinois State House | Source |
| 2020 Election Results by Precinct | Source |
| 2018 Election Results by Precinct | Source |
| 2016 Election Results by Precinct | Source |
This is not the first time we've held a primary on St. Patrick's Day, we've learned how to adapt. A good precinct captain knows how to get voters from the tavern over to the polling place, a great precinct captain knows how to get them back.
But the bars will be empty today as will most public places, this is the first time in a while we've held a primary during the middle of a global pandemic, and that disruption leads to far greater uncertainty. Ohio has cancelled today's primary but here in Illinois it will proceed as planned, although participation is certain to be smaller.
Our leaders are advising the public that it's too dangerous to eat a hot dog in the presence of strangers but they should also go vote, which is a bit of a mixed message (to put it diplomatically). Turnout will be lower for two reasons, 1) some people will be rightfully scared, particularly among older voters and other vulnerable communities, and will stay away, and 2) some voters will be disenfranchised when their polling place doesn't open due to the lack election workers, election equipment or both, and we've seen reports of these issues far greater than normal so far this morning.
It's almost impossible to predict what today's turnout will be. Below is a table showing the combined Democratic and Republican primary turnout going back two decades.
| Ballots Cast | 2018 | 2016 | 2014 | 2012 | 2010 | 2008 | 2006 | 2004 | 2002 | 2000 |
|---|---|---|---|---|---|---|---|---|---|---|
| Democratic Primary | 1,348,157 | 2,083,992 | 500,164 | 730,219 | 959,521 | 2,038,614 | 944,397 | 1,242,996 | 1,252,516 | 809,667 |
| Republican Primary | 739,834 | 1,460,341 | 837,394 | 948,178 | 783,060 | 899,422 | 735,810 | 661,804 | 917,828 | 736,921 |
| Combined | 2,087,991 | 3,544,333 | 1,337,558 | 1,678,397 | 1,742,581 | 2,938,036 | 1,680,207 | 1,904,800 | 2,170,344 | 1,546,588 |
Combined non-pandemic turnout would have certainly been higher than 1.5 million voters. In fact, given turnout increases in other states in affluent suburban areas it's possible that the Democratic primary alone would have been higher than 2 million voters, driven by increases in participation in suburban and collar counties.
Here are the known early vote and vote by mail totals, as of this morning. Each election authority has to report these totals to the State Board but they have up to two days to do so, for some counties/EAs these totals may be current, for others they may be a day or two behind. (note: these totals don't distinguish between Democratic primary ballots and Republican primary ballots, these are just the combined totals)
| Total VBM requested: | 296,072 |
| Total VBM outstanding: | 165,864 |
| Total VBM returned: | 130,208 |
| Return Rate: | 44% |
| Total Early Vote: | 584,708 |
| Total Grace Period: | 14,949 |
| Total Already Voted: | 729,865 |
At most half, and probably more like a third, of the people who would have voted in a non-pandemic election have already voted. That means a lot of people in the likely voter universe remain outstanding, some of whom won't vote for one of the two reasons above.
Also, as many as 165,000 vote by mail ballots could still be returned if they are postmarked by today. (note: this twitter thread shows how those numbers have grown over time)
Here's what to expect
Be patient. Only the results of large margin victories will be known tonight, if at all. More data may come in the next day or two, some data won't be in until two weeks later. Far less will be known about election results tonight than in any Illinois election in the modern era.
1) Don't automatically assume the first reported election results tonight include early vote. Each of the state's 108 election authorities (102 county clerks, plus 6 municipal election authorities: Chicago, Bloomington, Rockford, Galesburg, Danville and East St. Louis) have their own methods and procedures and it varies by election authority. None of them are legally allowed to count early vote and already received vote by mail ballots until after the polls close at 7pm. They can organize them, they just can't count them.
Today all staffs are strained. Many election day workers didn't show up and even regular staff may be unavailable due to self quarantine or other precautions. Some election authorities will count EV/VBM ballot first tonight, others will count them last once all of their other precincts are in and others won't count them until tomorrow or Thursday. Some of that happens in Illinois even during normal elections, today is not normal.
2) As many as 165,000 vote by mail ballots could still be returned if they are postmarked by today. Those valid ballots will arrive in the mail over the next few days and legally they can be counted if they are received any time in the next two weeks with a valid postmark. It should be noted that some of those ballots will be for the Democratic primary and some for the Republican primary, please don't automatically assume all will be returned and/or all will be for just one party's primary.
3) You will be able to see the totals by county/election authority of the number of ballots that remain uncounted or outstanding. These will be available on the State Board's website. Go to their homepage https://www.elections.il.gov/ --> (hover) Press Room --> Uncounted Ballots (righthand column under "Misc" heading).
4) In the days following today some election authorities will update their totals each day with newly received or counted data. Other election authorities won't make any updates after election night until the two weeks have passed. It will vary by election authority but in some parts of the state it may take the full two weeks before the results of close elections are known.
Please be patient and lower your expectations. Conducting an election is challenging in the best of circumstances and these are extraordinary times. It will also be safe to assume that the remaining unknowns are larger than you probably expect.
The Illinois General Assembly is considering SJRCA0001, a constitutional amendment to remove the prohibition against multiple personal income tax rates, essentially permitting an Illinois state graduated income tax. The Senate has approved the amendment and if the House does as well it will go before the voters for ratification on the 2020 ballot.
Per Article XIV, Section 2(b) of the Illinois state constitution there are two possible ways the proposed amendment could be ratified by the voters:
A proposed amendment shall become effective as the amendment provides if approved by either three-fifths of those voting on the question or a majority of those voting in the election.
That means it will either need 60% of the Yes votes or it will need a simple majority of Yes votes among all ballots cast. There will be some voters who cast a ballot but for whatever reason don't vote on this item on their ballot, those voters are included in the simple majority calculation for the latter ratification method.
For those who are working to try to ratify the amendment which of the two methods is easier? That depends, specifically it depends on the dropoff rate, the percentage of voters who cast a ballot but don't vote on this measure. If the dropoff rate is 0.00%, if every voter who takes a ballot votes on the amendment, then the denominator of both calculations is the same and you only need a simple majority of voters to ratify the amendment. However as the dropoff rate increases so does the threshold for ratification. If the dropoff rate is less than 16.667% it's easier to get a simple majority of those voting in the election than three-fifths of those voting on the question, otherwise the 60% threshold is the only path.
Here's a table showing the ratification and dropoff history for amendments going back to the 70's, based on this data source (see notes 1 & 2 below for data concerns). In the 80's and 90's it was common to have dropoff rates that were very large but that has changed in recent years. Looking back on the last three amendments to go before the voters all three had a dropoff rate lower than 16.667%.
| Cycle | Issue | Total Votes | Ballots Cast | Dropoff |
|---|---|---|---|---|
| 2016 | Transportation Lockbox | 4,811,115 | 5,627,149 | 14.50% |
| 2014 | Victim's Bill of Rights | 3,382,466 | 3,680,417 | 8.10% |
| 2014 | Voter Discrimination | 3,310,295 | 3,680,417 | 10.06% |
| 2012 | Pension Benefits | 4,337,888 | 5,236,120 | 17.15% |
| 2010 | Governor Recall | 3,285,617 | 3,780,779 | 13.10% |
| 2008 | ConCon | 4,555,927 | 5,539,172 | 17.75% |
| 1998 | Courts Commission | 2,084,123 | 3,541,379 | 41.15% |
| 1994 | Rights After Indictment | 2,431,908 | 3,219,122 | 24.45% |
| 1994 | Effective Date of Laws | 2,144,200 | 3,219,122 | 33.39% |
| 1992 | Crime Victim's Rights | 3,680,194 | 5,164,357 | 28.74% |
| 1992 | Education | 3,300,089 | 5,164,357 | 36.10% |
| 1990 | Tax Sales | 1,390,318 | 3,420,720 | 59.36% |
| 1988 | Voting Qualifications | 3,249,002 | 4,697,192 | 30.83% |
| 1988 | Delinquent Tax Sales | 2,533,075 | 4,697,192 | 46.07% |
| 1988 | ConCon | 3,627,253 | 4,697,192 | 22.78% |
| 1986 | Bail and Habeas Corpus | 1,771,133 | 3,322,657 | 46.70% |
| 1986 | Veterans' Property Tax Exemption | 1,588,346 | 3,322,657 | 52.20% |
| 1984 | Veterans' Property Tax Exemption | 2,190,345 | 4,969,330 | 55.92% |
| 1982 | Bail | 1,629,176 | 3,856,875 | 57.76% |
| 1980 | Legislative Article (Cutback Amendment) | 3,074,549 | 4,868,623 | 36.85% |
| 1980 | Revenue Article (Delinquent Tax Sales) | 2,656,407 | 4,868,623 | 45.44% |
| 1978 | Personal Property Tax | 1,686,261 | 3,342,985 | 49.56% |
| 1978 | Veterans Organizations' Post Homes Exemption | 1,554,486 | 3,342,985 | 53.50% |
| 1974 | Governor's Amendatory Veto | 2,632,032 | 3,047,822 | 13.64% |
Oddly enough, of those three the transportation lockbox amendment probably had the most media attention, but it had a higher dropoff rate than either of those in 2014. That may be due to the fact that it was the only one of the three on the ballot in a presidential election year, where you have more low-information voters participating who may not vote all the way down the ballot.
Why have modern elections had a much lower dropoff rate than those from late last century? It's hard to say but a likely explanation has to do with changes in the way we vote. It varies county to county but many counties in the state now have touchscreen voting machines or other electronic methods and it's common for those voting systems to warn voters when they've undervoted any questions and we're seeing a significant reduction in dropoff votes now.
Here's a table of the Yes vote needed to pass the measure with a simple majority of all ballots cast at different dropoff rates:
| Dropoff | Yes/BC | Yes % |
|---|---|---|
| 0.00% | 50.01% | 50.01% |
| 1.00% | 50.01% | 50.52% |
| 2.00% | 50.01% | 51.03% |
| 3.00% | 50.01% | 51.56% |
| 4.00% | 50.01% | 52.09% |
| 5.00% | 50.01% | 52.64% |
| 6.00% | 50.01% | 53.20% |
| 7.00% | 50.01% | 53.77% |
| 8.00% | 50.01% | 54.36% |
| 9.00% | 50.01% | 54.96% |
| 10.00% | 50.01% | 55.57% |
| 11.00% | 50.01% | 56.19% |
| 12.00% | 50.01% | 56.83% |
| 13.00% | 50.01% | 57.48% |
| 14.00% | 50.01% | 58.15% |
| 15.00% | 50.01% | 58.84% |
| 16.00% | 50.01% | 59.54% |
| 16.67% | 50.01% | 60.01% |
If the dropoff rate for the upcoming vote is only 1% then it will simply need a Yes vote of 50.52% to pass, if the dropoff rate is 15% it will need a Yes vote of 58.84% to pass. It will automatically pass with a Yes vote of 60% or greater via the "three-fifths of those voting on the question" method.
Both sides are already spending on TV at a significant rate and that is before the measure has passed both houses of the General Assembly, it's likely that if the measure goes before the voters for ratification the media spending will grow even further. That kind of paid media attention will probably reduce the dropoff rate lowering the threshold needed for passage. That presents a difficult predicament for opponents, by bringing more attention to the measure, even negative attention, it will likely reduce the dropoff rate lowering the threshold needed for passage but they really don't have better options. If opponents encourage voters to skip voting on the measure then they run the risk of only Yes voters voting, which isn't an improvement.
What is clear though is that unless the Yes votes are well above 60% the outcome may not be known for certain until well after election day. It's entirely possible we have to wait until the vote totals are certified to be able to run the simple majority calculation on ballots cast.
Data Note 1: this was the data source for much of the historical data in the table above, however it has at least one error on it, probably a copy/paste mistake, the ballots cast number on the 2014 Voters Rights question is definitely wrong.
Data Note 2: for recent elections the ballots cast number is available via the State Board of Elections website in the Official Vote Total Book. However that report lists ballots cast numbers that are different in different locations. For example in the 2016 book it is listed as 5,666,118 on page ii for the purpose of calculating turnout but page vi lists it as 5,627,149. The 2014 book has the same issue, ballots cast is listed as 3,680,417 on page ii for the purpose of calculating turnout but on pages 4 and 8 it's listed as 3,667,206. Last week I emailed the State Board asking for a clarification, if I hear back from them I'll provide an update.
For those of you keeping an eye on the 2019 Chicago Municipal elections here's a rundown of the many useful resources offered by Illinois Election Data.
Free Stuff:
Candidate List: Candidate filing starts tomorrow Monday, November 19th and ends on Monday, November 26th. Candidates for Mayor, Clerk and/or Treasurer have to file 12,500 valid petition signatures while candidates for alderman have to file 473 valid petition signatures, along with other required documents.
We have a CANDIDATE LIST that will be freely available to all and updated throughout. Right now we have candidates listed for every citywide and aldermanic office, mostly a combination of incumbents, announced candidates, candidates that have created a fundraising committee with the State Board of Elections and candidate names that have been sent to us by the many helpful people who have offered suggestions on social media (thank you!). Starting tomorrow we'll update the candidate list noting those who have filed, adding those who filed who we weren't aware of and after the filling deadline passes we'll remove those that didn't file. Once the process for signature objections/challenges begins we'll keep track of all of those objections, those who were removed or withdrawn and those that won their challenges. Keep an eye on the CANDIDATE LIST, it will be updated throughout.
Maps, Maps, Maps: If you're interested in past elections we have MAPS for the 2011 and 2015 Chicago Municipal elections. For the three citywide offices (Mayor, Clerk & Treasurer) we have MAPS for the entire city by both ward and precinct. For every aldermanic race in those two cycles we have results MAPPED by precinct.
For example if you wanted to see the results of the 2015 Chicago Mayoral runoff between Rahm Emanuel and Chuy Garcia those maps can be found here: (Emanuel by Ward/Precinct, Garcia by Ward/Precinct). If you want to see an example of an aldermanic race here are the mapped results by precinct for the 2011 election in the 47th ward between Ameya Pawar and Tom O'Donnell: (Pawar by precinct, O'Donnell by precinct).
Note: precinct boundaries change all of the time and in Chicago they were different in 2011 and 2015. You can download a list of the number of Chicago precincts in each ward in each election here.
Vote History: If you'd like to see statewide election results for each ward our ANALYSIS section has vote total history for statewide races by ward for general elections as well as Democratic and Republican primaries going back to the 90's.
Subscriber Info:
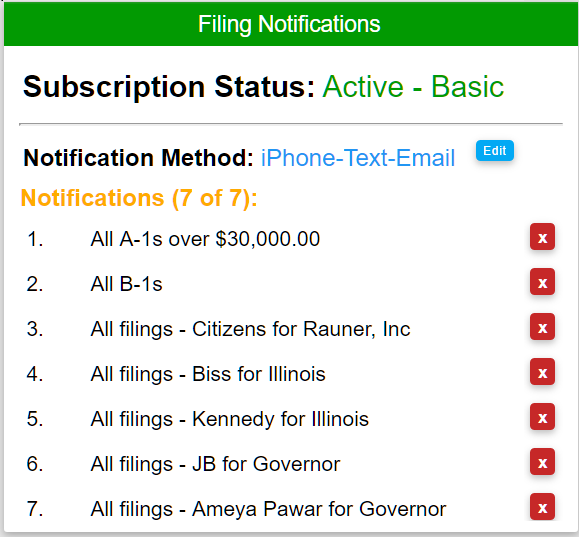
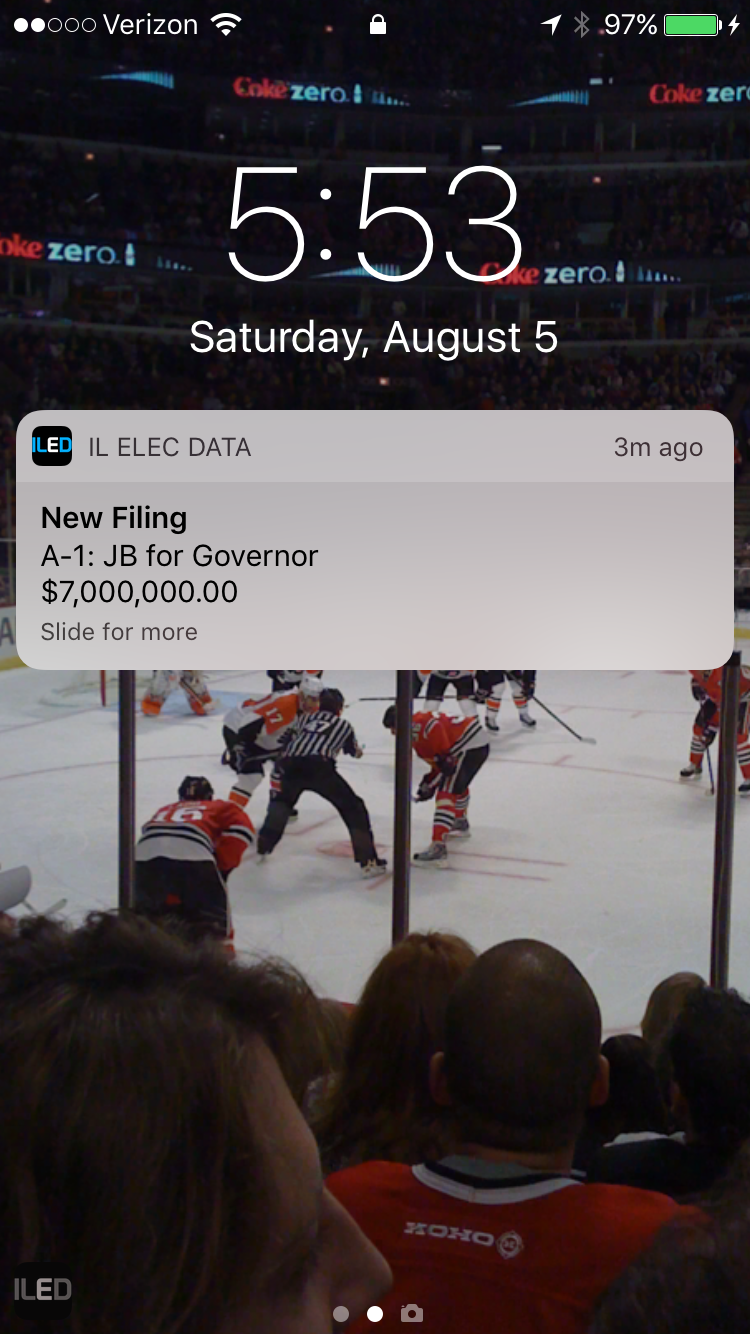
Immediate Notifications: Subscribers can SIGN UP to receive immediate notifications of selected campaign finance filings, a great tool for campaign managers to keep an eye on the latest developments from their opponents and for PAC directors trying to stay on top of the latest developments in various campaigns. Subscribers can sign up to receive notifications of specified filings within a minute or two of being filed (my server checks for new filings every 2 minutes). You can choose whether to be notified by email, text or iPhone alert.
A Basic subscription is $15.00/month and allows for up to 10 different types of notifications along with full access to all up to the minute information on districts, races and campaign financial reports for the current election cycle. For anyone who needs to track more than just 10 types of notifications a Deluxe subscription is available for $30.00/month for unlimited notifications along with full access to all up to the minute information on districts, races and campaign financial reports. Step by step instructions are available along the right side of the SIGN UP page.
Note: the iPhone app is still the best way to receive immediate notifications but the app itself is a bit out of date. I hope to update the features available in the app soon but I have to buy a new Mac first so it won't be right away.
District Financial Profiles: Subscribers also have access to the financial profile for every race, both citywide races and aldermanic races. Here's an example, here is the current financial profile for the likely candidates in the 14th Ward: example. These profiles show the current cash and past spending for each candidate's committee plus any affiliated committees. For example Alderman Burke has his own candidate committee along with the ward fund and his Burnham Committee PAC. Wherever possible we've tried to include these affiliated committees. Subscribers can view these totals for every race in the SUBSCRIBERS section.
Current Cash - All Candidates: Subscribers also have access to the current estimated cash position of all candidates, here's an example. This report combines the cash on hand from the last quarterly filing plus any cash reported on A-1's since minus any cash out reported on B-1's since (unlikely for these committees but it's there anyway) and this gives you an estimated cash available. Because we see large cash in on A-1's in between quarterly filings but do not have much info about spending this total does not take into account any normal spending by the committee since the last quarterly report so it's more of a guide than an exact approximation. As with the district financial profiles we've also included the affiliated committees as you can see in the example below Toni Preckwinkle. Subscribers can view these totals for every race in the SUBSCRIBERS section.
I hope you find these resources useful. Good luck!
Thanks to Matt Dietrich at the Illinois State Board of Elections and to Cris Cray who put these county by county totals together for the Election Assistance Commission and shared them with us.
Here you can find the historical totals for early vote, vote by mail, absentee, grace, provisional and same day vote totals, where available. For some years we have county by county totals with more granular data. This dataset is not perfect but it's a helpful guide and as far as I know it's all there is.
To the members of the Illinois General Assembly:
I ask you to review the Illinois election code and consider making some changes. It is currently impermissible for county clerks (or municipal election authorities) to count the ballots of completed early voters and/or the ballots of completed vote by mail voters prior to the polls closing at 7pm on election night.
In 2014 the Attorney General provided clarification to the LaSalle County State's Attorney on this matter after reviewing the clear language of the law and concluded that "no absentee voters' ballots or early voters' ballots should be placed into the tabulators prior to 7:00 p.m. on the day of the election." She shared this opinion with all of the local election authorities.
I hope that the General Assembly will consider reviewing this matter and consider permitting the election authorities to count completed ballots as they see fit so long as they do not release or make public any results before the polls close, for two reasons:
- To give voters greater confidence in our electoral process, election night is the time of year when voters are most closely paying attention and our current setup increases the likelihood of providing them with only partial results on election night.
- To give election authorities greater operational flexibility rather than needlessly forcing them to complete so many tasks all at the same time.
Because election authorities are not allowed to count early/VBM ballots prior to the polls closing many don't start counting them until after they get all of their election night precinct totals completed and reported. This often means that on election night even if you see 100% of the precincts reported in a particular county they may still have plenty of early and vote by mail ballots in hand that still need to be counted, which can give a misleading impression to people watching the returns at home.
On the afternoon of general election 2016 I looked up the current totals for early vote and vote by mail and posted that 352,428 vote by mail ballots had already been returned while another 1,390,019 had early voted statewide. Combine these figures with the 44,722 grace period voters and it adds up to at least 1,787,169 ballots completed prior to election day. The total number of ballots cast for the 2016 general election was 5,666,118 which means that 31.5% of the total ballots cast in Illinois in the 2016 general election were already in the hands of the various election authorities by the morning of election day.
To point #1 above, it's concerning that voters at home watching returns on election night are led to believe that most or all of the vote has been counted, especially in very close races, when in reality as much of a third of the vote in hand may not be included in the returns even though 100% of the precincts are listed as reported. It is potentially misleading and can cause mistrust. In the State Treasurer's race of 2014 Tom Cross went to bed on election night with a lead of about 22,000 votes. However, many early vote and vote by mail ballots still were left to be counted and once they finally were, along with properly postmarked late arriving mail ballots, the outcome flipped with Mike Frerichs declared the winner by about 9,000 votes. Providing the public with one expected outcome on election night based on partial information in a very close race only to have the outcome change days later can erode confidence in our electoral system, which may be unnecessary when a better alternative is available.
To point #2 above, we should give our election authorities greater flexibility to meet their enormous election day tasks, including counting and tabulating results. Not that long ago the only way a registered voter in Illinois could vote was in his/her polling place on election day or via absentee ballot if and only if they met the qualifications to vote absentee. However since 2006 we have added early voting, vote by mail and in-precinct same day registration. In the last 12 years the complexity of conducting an election has grown exponentially, and in most cases without a corresponding growth in the resources necessary to manage this complexity. The state's 109 election authorities come in various sizes and each has their own challenges but all would benefit from greater flexibility for meeting the enormous demands placed on them on election night.
There are reasonable arguments against my proposal and they should be carefully considered by the General Assembly before enacting any legislation, some of which were mentioned at the end of the Attorney General's letter.
- It is possible that tabulating election results prior to the completion of the vote could give one party an advantage or could affect the outcome of the election if that information were to leak.
- Additionally by waiting until after the polls close to count any/all ballots the election authorities may ensure that each political party, candidate and/or qualified civic organization has the opportunity to observe the entire ballot counting process.
These are valid concerns that would require thoughtful safeguards to protect the electoral process. I'm hopeful that the General Assembly will consider a bill this session to improve our process, take testimony from interested parties to ensure that no other unintended consequences arise that haven't been previously considered and can craft and pass legislation that would improve our current system.
Update:
After talking with some people today I'm told that while election authorities are still not allowed to count results of ballots received prior to 7pm on election night there was some language added to the election code that gives them some additional flexibility, specifically:
(10 ILCS 5/19-8) (from Ch. 46, par. 19-8)
Sec. 19-8. Time and place of counting ballots.
(b) Each vote by mail voter's ballot returned to an election authority, by any means authorized by this Article, and received by that election authority before the closing of the polls on election day shall be endorsed by the receiving election authority with the day and hour of receipt and may be processed by the election authority beginning on the day it is received by the election authority in the central ballot counting location of the election authority, but the results of the processing may not be counted until the day of the election after 7:00 p.m., except as provided in subsections (g) and (g-5).
I'm told that this language allows the election authorities greater flexibility in handling some of the more time consuming tasks prior to election night while still not technically counting totals until after the polls close.
I'm thrilled to announce two new developments for the 2018 cycle, 1) we now offer a subscription service for immediate notifications for all different types of filings, and subscribers will have full access to all of the reports on districts, races and campaign financial status available to subscribers in the SUBSCRIBERS section, and 2) we have created a free iPhone/iPad app now available in the app store, there is plenty of useful information available to anyone who downloads the free app and ILED subscribers can log in the app and access all of their subscriber information as well.
I often tweet out many of the most interesting campaign finance news just moments after the latest reports are filed because I've programmed my server to send me an alert anytime something interesting happens, now I want to extend that functionality to you. For just $15/mo (roughly the cost of a single cab ride) you can sign up to receive immediate notifications for various types of filings. This is great for campaign managers who need to keep an eye on their opponent(s), you can sign up to receive an immediate notification any time one of your opponents has a new filing. You can receive a notification in any or all of three different ways, 1) by email; 2) by text message and/or 3) by iPhone/iPad notification from the app (this is the quickest and most reliable of the three options).
Full Subscription Details and Instructions
In addition to notifications subscribers will have access to the SUBSCRIBERS section (in the nav bar above). There are all sorts of great reports in the subscribers section including district profiles, financial summary reports for each race, cash on hand reports for every state and federal candidate, leadership committee and IE committee as well as summary and detail reports for all IE spending. The reports cover all statewide, legislative (state senate and state rep), congressional, Cook County countywide and Cook County board races. Click on the SUBSCRIBERS section link to see a list of all the reports that subscribers will have access to.
For anyone that might be interested or is considering signing up take a look at the subscription details and instructions page. There you can find tables that specify the type of notifications you can sign up for and all of the reports that are available to subscribers. There is also a step by step instruction guide on the right side that explains how to sign up.
Who should subscribe:
- Campaign managers
- Opposition researchers
- Consultants
- Anyone who is closely tracking any or many races
Who maybe shouldn't subscribe:
- Congressional campaigns - unfortunately there just isn't enough new info on a day to day basis to justify paying a monthly fee
New iPhone/iPad app
A new Illinois Election Data iPhone/iPad app is now available in the App Store.
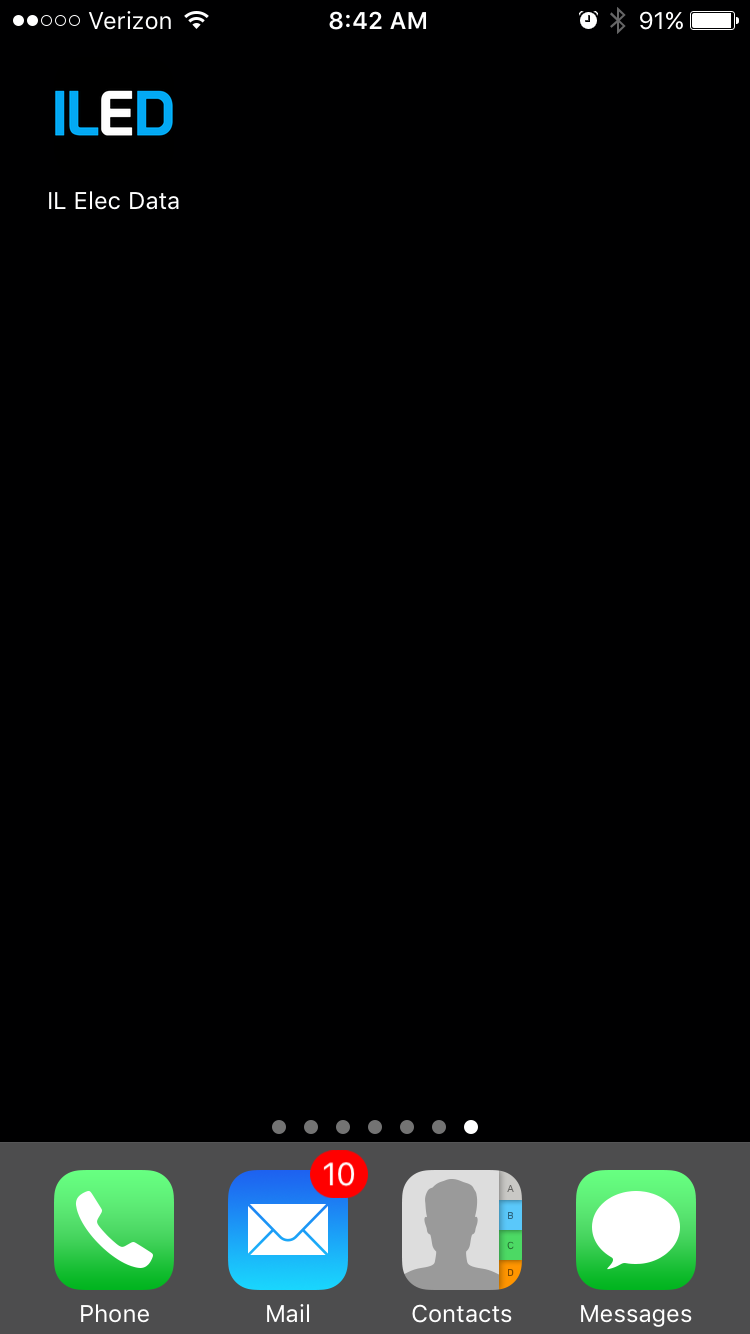

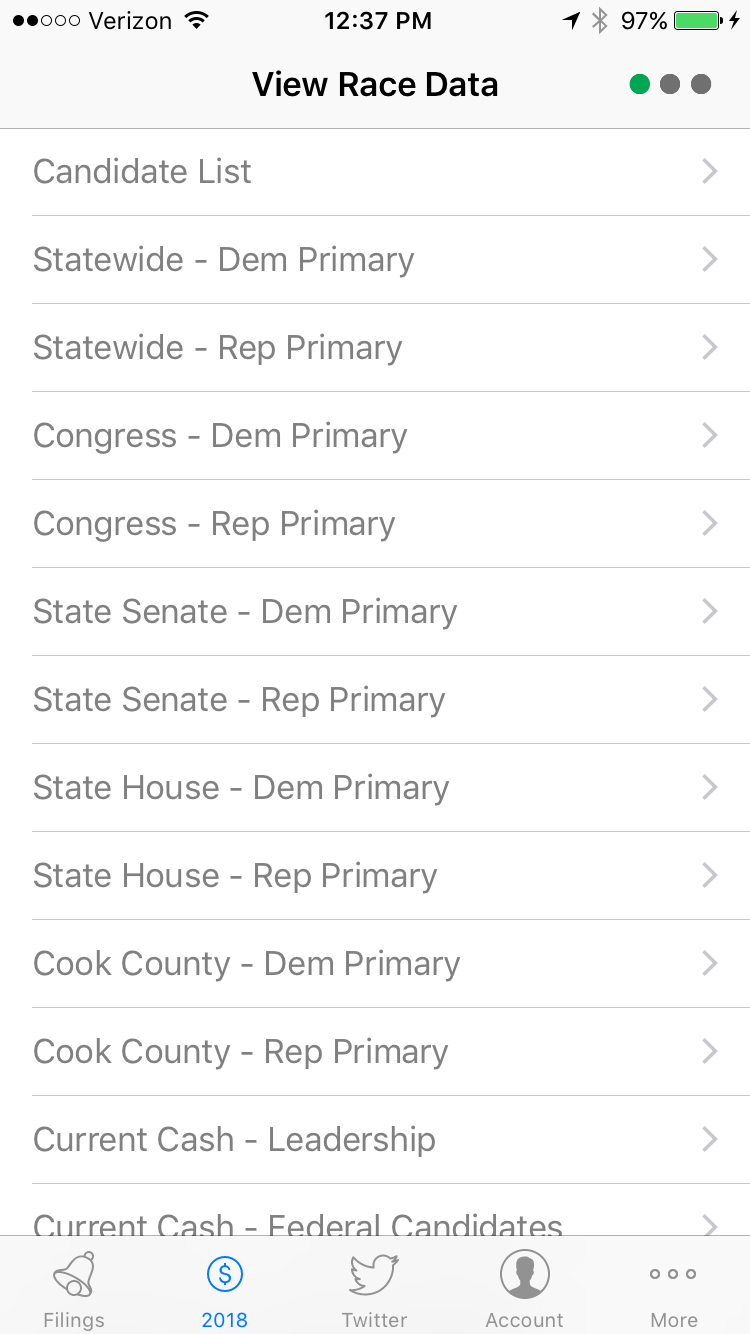

The app is now available in the App Store and is free to download and it contains plenty of useful information at no additional charge. In addition to all of the freely available information, subscribers can log in and access all of their subscriber data through the app including instant notifications.
Congressional District Profiles
I have district profiles like this for every congressional, state senate, state representative and Cook County board district in the subscribers section. However since congressional races don't really generate enough new content day to day to justify a subscription I'm releasing these congressional district profiles for free.
| IL-01 | IL-07 | IL-13 |
| IL-02 | IL-08 | IL-14 |
| IL-03 | IL-09 | IL-15 |
| IL-04 | IL-10 | IL-16 |
| IL-05 | IL-11 | IL-17 |
| IL-06 | IL-12 | IL-18 |
Other Options
ILED subscriptions are not for everyone, some of you need access to this type of information occasionally but not often enough to justify a monthly subscription. You may remember that last cycle I helped publish something called "The Illinois Racing Form" with The Daily Line (formerly Aldertrack). I am no longer involved with the publication of the Racing Form but I think they are doing that again this cycle. I believe they plan to generate a large document with plenty of useful campaign info that they will update from time to time that is available for a one-time fee. Check with them for details but something like that may be a better fit for some of you.
Rauner says GOP will win 9 House seats next year to knock Madigan out of Speakership
— Tony Arnold (@tonyjarnold) August 16, 2017
While speaking to fellow Republicans at the State Fair this morning Governor Rauner announced his intention to try to win 9 seats in the State House next year. In 2016 the Republicans had a net pickup of four seats in the House and there are now 67 Democrats and 51 Republicans, the GOP would need to pick up 9 seats to win the majority in the House.
State House
Here are two lists side by side, one is a list of all the State House districts currently held by Democrats from most to least Republican and the other is a list of all districts currently held by Republicans from most to least Democratic.
|
|
State Senate
Here are two lists side by side, one is a list of all the State Senate districts currently held by Democrats from most to least Republican and the other is a list of all districts currently held by Republicans from most to least Democratic. The Senate currently has 37 Democrats and 22 Republicans, the Republicans would need to pick up 8 seats to win the majority.
|
|
Congress
Here are two lists side by side, one is a list of all the Illinois Congressional districts currently held by Democrats from most to least Republican and the other is a list of all districts currently held by Republicans from most to least Democratic.
|
|
Methodology - I combined the vote totals by district for the 2012 race for President, 2014 races for US Senate, Governor, Attorney General, Secretary of State, Comptroller and Treasurer and the 2016 races for US Senate and Comptroller and then ranked them. I did not include the 2016 Presidential because the regional voting patters by party were substantially different than typical and were a) not necessarily indicative of relative party strength and b) probably unique to the dynamics of that specific race.
From time to time when the Governor files a new A-1 including (relatively) small donations from supporters someone will ask why donors are contributing to Rauner given his capacity to self fund. With such a large amount of the funding on the Republican side during the 2016 cycle coming from Rauner and just a few of his wealthy allies it's easy to mistakenly assume that his donor pool in 2014 was small as well but that was not actually the case.
Here is a breakdown of Governor Rauner's fundraising in 2014:
Citizens for Rauner, Inc.
Campaign Fundraising up to Election Day 2014
| Contributor | Amount |
|---|---|
| Bruce Rauner | $27,526,000.00 |
| Republican Governors Association | $8,689,000.00 |
| Ken Griffin | $5,589,295.18 |
| Illinois Republican Party | $3,289,648.10 |
| Richard Uihlein | $605,300.00 |
| The Rest | $24,234,633.54 |
| Subtotal | $69,933,876.82 |
Fundraising on December 31, 2014
| Contributor | Amount |
|---|---|
| Bruce Rauner | $10,000,000.00 |
| Ken Griffin | $8,000,000.00 |
| Richard Uihlein | $2,000,000.00 |
| Subtotal | $20,000,000.00 |
| Cycle Total | $89,933,876.82 |
|---|
Not including the $20 million Rauner added on New Year's Eve 2014, he raised just shy of $70 million for the 2014 Governor's race, although about $8 million of that was transferred to the Illinois Republican Party. In 2014 about $46 million of Rauner's total came from himself, the state and national party and his few wealthy allies but he still raised over $24 million from traditional Republican supporters and other various donors. That is roughly comparable to the $23 million Rod Blagojevich spent in 2002 to win the Governor's race, a not insignificant amount. Even though Bruce Rauner is currently sitting on $70 million ($50 million from himself, $20 million from Ken Griffin) he's likely to continue to raise money from traditional sources for the remainder of the election.